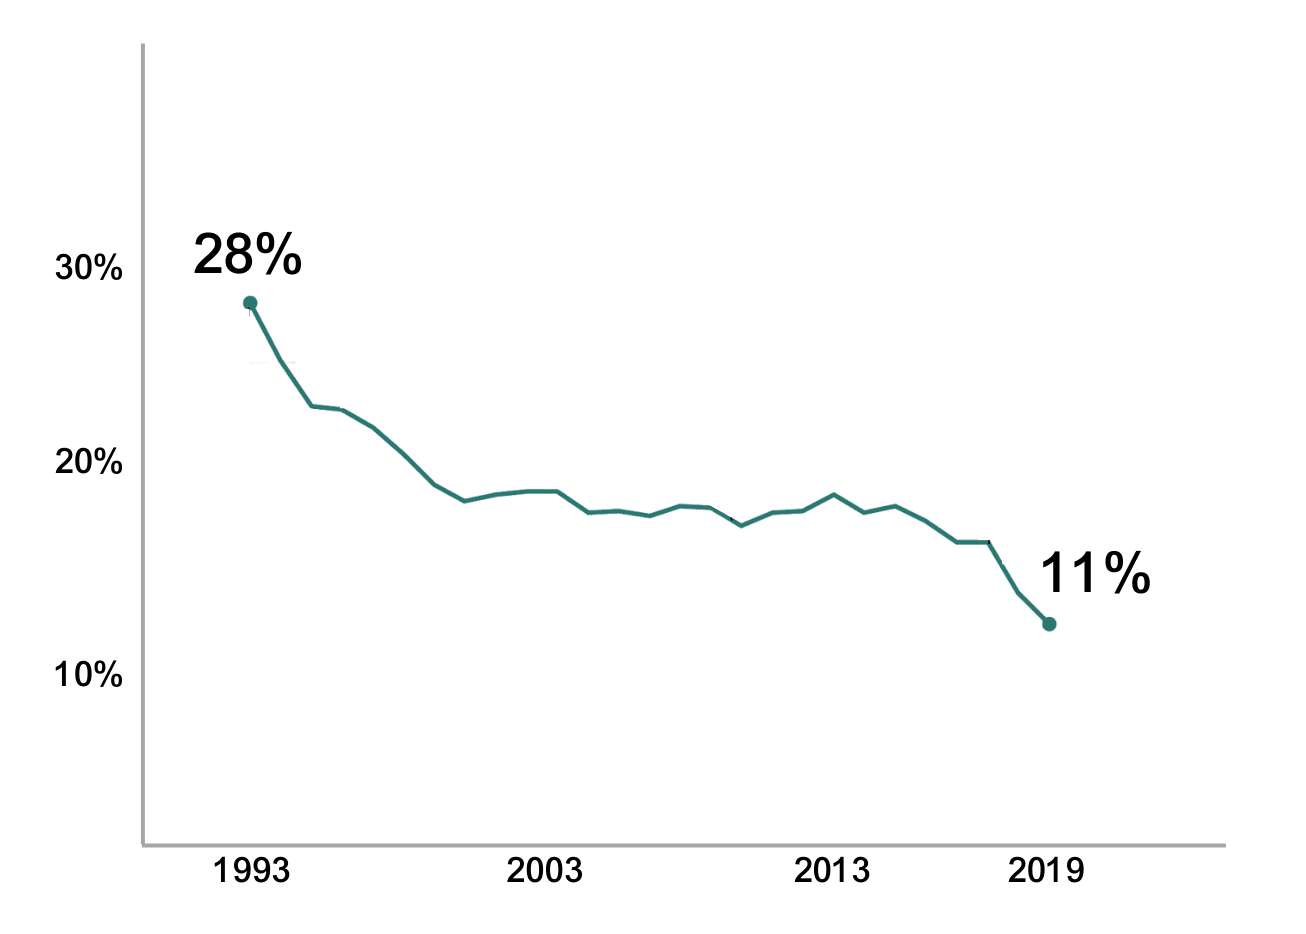
What does this chart show?
31 votes
The decline in newspaper subscribers nationwide.
33%
19 votes
The decline in child poverty in the U.S.
20%
23 votes
The decline in U.S. citizens who say they are somewhat or very hopeful about the future.
25%
20 votes
None of the above.
22%
Votes